Key takeaways
- Online stores have return rates that are up to three times higher than brick-and-mortar stores.
- 71% of shoppers say a bad return experience makes them less likely to buy from that brand again.
- Of the $706 billion in returns in 2025, an estimated $100 billion was fraudulent.
As of Q1 2026, 54% of US internet users returned an online purchase in the previous 12 months, up four percentage points from the previous year.
As an online seller, return management is not something you can leave to chance. Returns affect your profit, inventory, operations, and customer relationships.
This guide brings together the latest statistics, industry benchmarks, and practical strategies to help you manage returns and protect your margins.
What is an E-commerce Return Rate?
An e-commerce return rate measures the percentage of orders that are sent back to you. While some returns are expected, a high return rate signals something is off with either your product or your customers’ expectations.
Formula for Calculating E-commerce Return Rate
(Units Returned ÷ Units Sold) × 100 = Return Rate %
Example: You sold 250 pairs of shoes last month and 30 were returned. Divide 30 by 250 to get 0.12. Multiply by 100. Your return rate is 12%.
A few common mistakes to avoid:
- Don’t include canceled orders, pending exchanges, or items still in transit.
- Count only confirmed, physically returned items.
- Calculate within a defined time window (e.g., a month or a year), not a rolling mix of both.
Key E-commerce Return Statistics
Next, let’s look at the numbers that matter most, like the overall e-commerce return benchmarks, return rates across industries, and the common reasons behind them.
Comparing E-commerce Return Rates Across Industries
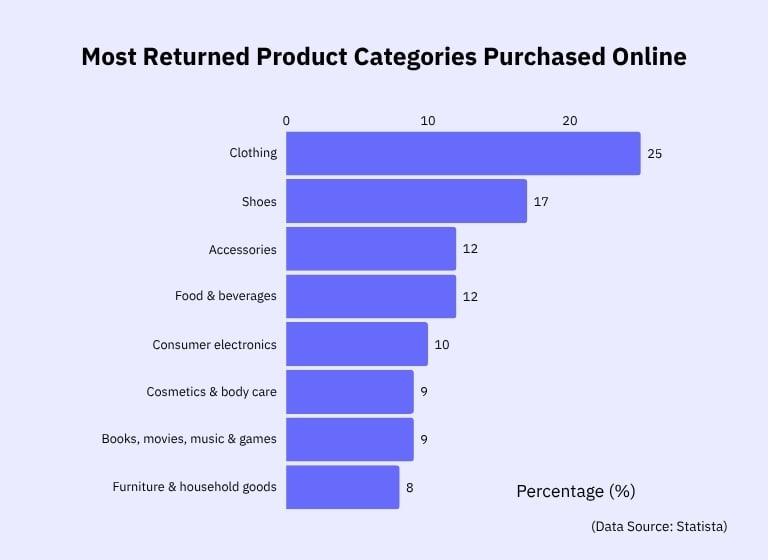
Statista’s report found clothing leads all categories, with 25% of online shoppers returning apparel purchases, followed by shoes (17%) and accessories (12%). Furniture and household goods see the lowest return frequency at 8%.
Here are some pro tips if you’re in these high-return categories:
- Add accurate product descriptions and real-life photos to reduce unmet expectations.
- Offer store credit for returned items to recover potential lost revenue.
- Use a return window that fits the product type. For example, apparel may need 30 days, but electronics should have a shorter return window to avoid misuse.
Common Reasons for E-commerce Returns
Now that we know what most returned items are, let’s talk about the common reasons behind that.
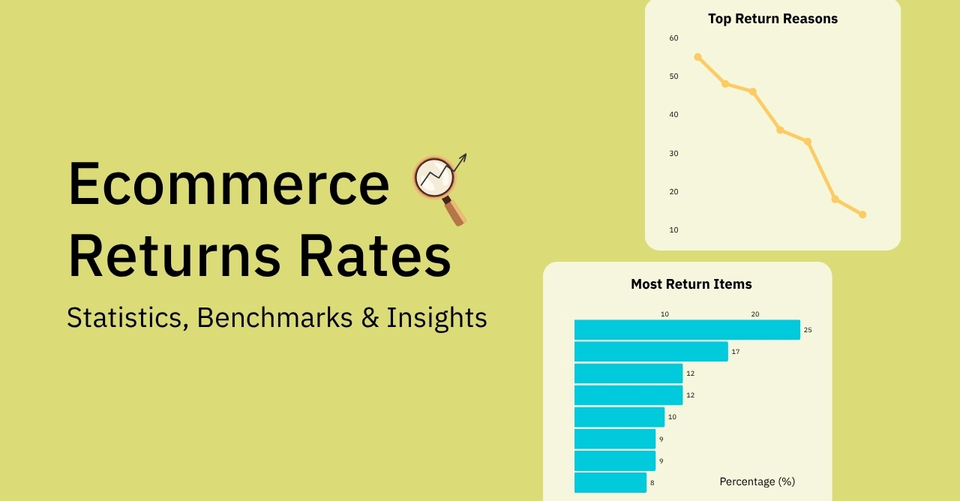
The top three reasons for e-commerce returns mentioned by eMarketer are:
- Incorrect size, bad fit, and color (55%)
- Damage or defects (48%)
- Poor quality (46%)
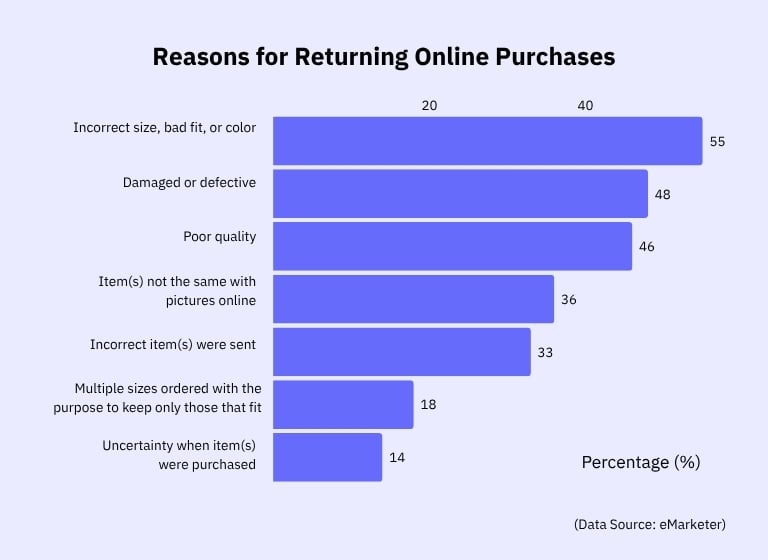
Size, fit, and color are exactly where clothing and shoes struggle, which is why fashion leads every return-rate table.
Damage or defect is something that you can work on with proper quality control. If quality is what’s driving returns, change your materials.
If you want to avoid these issues, here’s what you can do:
- Provide actual measurements of your products. For example, include size charts, model references, and even fit notes, such as “runs small” or “relaxed fit.”
- Show your products on different body types and in different lighting.
- Add customer reviews that mention quality, durability, and fit.
Return Rate Differences: Online vs Brick-and-Mortar Stores
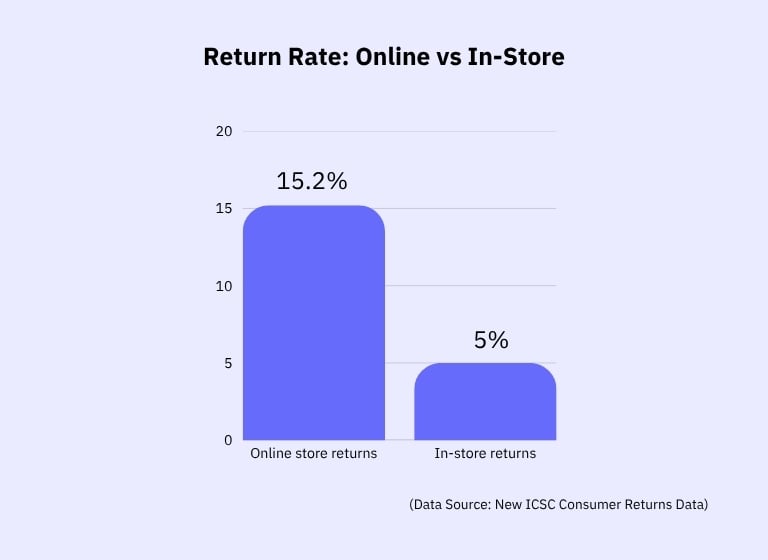
Online stores have return rates that are up to three times higher than brick-and-mortar stores.
A 2024 ICSC survey found:
- Online return rate: approximately 15–20%
- In-store return rate: approximately 5–9%
The difference comes down to information. In a physical store, customers can try items on, check colors in natural light, and verify sizing before committing. Online, that entire decision rests on photos and descriptions, and when expectations don’t match reality, the item comes back.
E-commerce Return Rates by Gender and Generation
Who’s more likely to return their orders? And who keeps unwanted items instead of sending them back?
Here’s what the data says:
- Women are about 1.5 times more likely to return products than men.
- Millennials (30–45) and shoppers with kids top the list for using items before returning them (up to 56%).
- Gen Z and Millennials often skip returns due to inconvenient or unclear return policies.
Return behavior isn’t only about product fit—it tracks with lifestyle and with how easy the process feels.
Pro Tip: Make your return policy transparent, easy-to-read, and a bit flexible, especially for busy or young shoppers. That can help you increase customer satisfaction with online purchases and build customer loyalty over time.
Geographical Variations in E-commerce Return Rates
Return habits can also be affected by where the online shoppers (and store owners) are based, according to Statista. In India, 81% of shoppers returned something they bought online in the past year. That’s much higher than 48% in the US, 54% in Germany, or 40% in South Africa.
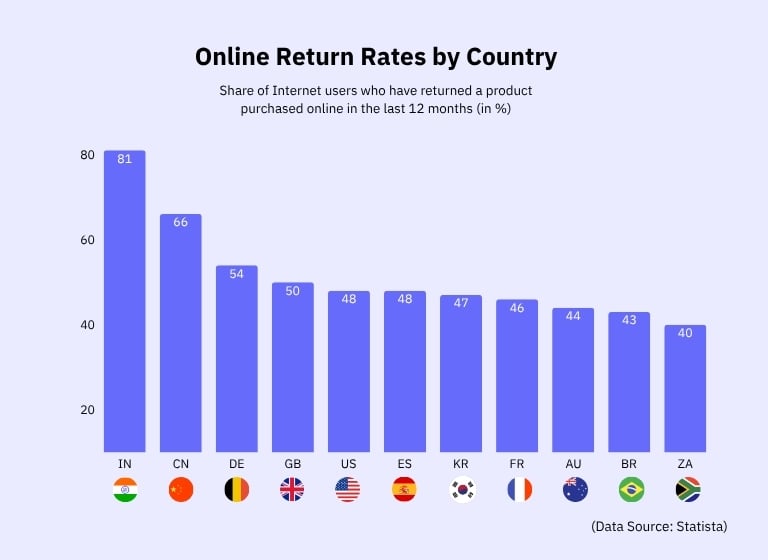
Return rates vary significantly by country, and the drivers aren’t uniform. High e-commerce adoption, consumer protection laws, and cultural norms around purchasing all play a role.
Just look at places like Spain and France, where shoppers are entitled to a 2-year guarantee (under EU law). That means sellers are expected to fix or refund faulty products with minimal inconvenience.
E-commerce Return Rate Fluctuations
The post-holiday return rush can get a little crazy. Knowing that spike is coming is what lets you staff and stage for it.
According to Salesforce, at least 10% of US e-commerce orders were returned each week during last year’s holiday season, with some weeks hitting 16%.
Pro Tip: Automate approvals for low-risk items to avoid managing everything manually on busy days. For example, you could set some of your apparel to auto-approve returns within 14 days of delivery.
But to do that, you need good returns management software, like CWILL Returns & Exchanges. This self-service portal allows your customers to manage their own returns and track them in real time. You can set rules and choose which items can be returned. Plus, you can offer refunds, exchanges, or store credit, all from a branded return page.
Return Fraud and Abuse in E-commerce
Of the $706 billion in returns in 2025, an estimated $100 billion was fraudulent, around 14.2% of all returns.
Apparel brand PacSun encountered this at scale: one customer returned 250 orders totaling $24,000, and none of the items ever reached the warehouse. Buyers were sharing refund exploits through Telegram groups.
The challenge is that overly strict policies punish loyal customers. The better approach is targeted: build verification into your return flow, set behavioral thresholds that flag unusual activity, and create controls that catch abuse without adding friction for legitimate customers.
For more on protecting your business, see our guide on return fraud.
How High Return Rates Affect Your Business on Your E-commerce Business
The impact goes well beyond the refund itself. Here’s what’s actually at stake:
- Financial costs: Processing a return costs retailers between $10 and $65 per item once you factor in return shipping, inspection labor, repackaging, and non-refundable payment processing fees. More than 30% of returned items can’t be resold at their original price, compounding the loss.
- Operational strain: Items sitting uninspected in the returns queue inflate your available stock count and make overselling more likely — triggering canceled orders, support tickets, and avoidable negative reviews. During peak season, a process that barely holds together in quieter months can break down fast.
- Customer loyalty: 71% of shoppers say a bad return experience makes them less likely to buy from that brand again. But get it right, and 76% of first-time buyers who have a smooth return become repeat customers.
Key Strategies to Reduce E-commerce Return Rates
Now that you understand the impact of e-commerce returns on your business, it’s time to learn how to reduce them. You can start by optimizing your product presentation and improving quality.
Optimizing Product Presentation & Information
Your product pages are doing most of the selling work for your e-commerce store. When customers can’t touch or try products before buying, these pages need to answer every question they might have.
The simplest way to start is with your product descriptions. Replace generic copy with descriptions that cover size, materials, fit, and how the product actually works in real life. Then, you can partner it with images that show multiple angles.
ASOS is a good example of this done well. Each product page includes multiple image angles, a short video walkthrough of the item in motion, and a “Fit Assistant” tool to help shoppers land on the right size before they buy.

Improving Quality Control & Fulfillment
When it comes to reducing e-commerce return rates, quality control is one area you cannot afford to overlook.
Take OLIPOP, a functional soda brand known for its focus on safety and consistency.
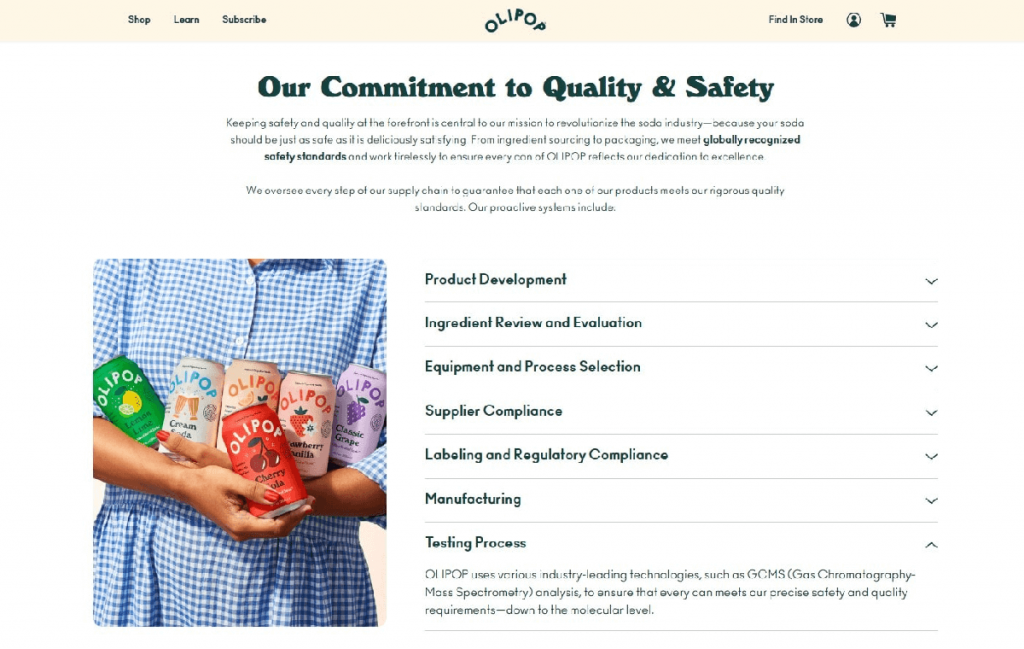
They review every step of their process, from working only with approved suppliers to testing each batch in certified labs. This level of attention helps make sure that what customers get is exactly what was promised.
Fulfillment is just as important. If the wrong flavor shows up or the package is damaged, returns are almost guaranteed. (We’ve seen this happen more than once with small teams juggling orders.)
Before your next sale goes out, ask yourself: Are you double-checking orders? Are your packing materials keeping products safe in transit?
These small steps have a big impact on customer satisfaction and can make or break your return numbers.
Learn More:
How to Reduce Returns in E-commerce
Conclusion: What the Data Tells You and What to Do Next
E-commerce return rates are rising, and the cost in labor and customer trust is real. The businesses that manage returns well treat them as a core part of the customer experience by investing in high-quality product pages and closing the expectation gap.
If you want to reduce returns, here’s a good way to start:
1. Pull your most commonly returned products
2. Review what customers say when they initiate a return
3. Build a return process your team can execute reliably at scale
Ready to make returns and exchanges less of a burden for your team and customers? CWILL Returns & Exchanges gives you a branded self-service portal, automated approval rules, store credit options, fraud controls, and more.

Make returns and exchanges hassle-free to reduce costs
FAQs
It depends on what you sell. The industry average for online returns sits at approximately 15-20%, but that number means different things in different categories. The more useful question isn’t whether your rate is above or below average, but whether it’s trending up. A rising return rate in a specific SKU or category is a signal to investigate the root cause.
In a physical store, customers can try items on, check colors in natural light, and verify sizing before buying. Online, that decision is based entirely on photos and descriptions. That information gap is the primary reason online return rates run up to three times higher than in-store rates.
Invest in product presentation: accurate size charts, multi-angle photos, video demos, and customer reviews that address fit and quality. Make your return policy clear and easy to find. Lastly, use your return data to identify and fix the root causes of returns in your catalog.
Return fraud occurs when customers exploit your return policy by returning used or non-purchased items, or claiming items were never delivered. Prevention means setting behavioral flags for unusually frequent returners, requiring proof of return shipment, and building verification into your return flow, without adding unnecessary friction for legitimate customers.
Note: This blog was originally written in English and translated using an automated tool to make the content accessible to a global audience. We believe in sharing valuable insights with everyone and apologize for any inaccuracies. If you spot any errors, please feel free to contact us for corrections. Your feedback helps us improve and ensures the content’s value is fully realized.

Content Director | 9+ years decoding B2C & B2B eCommerce, obsessed with SaaS and retail storytelling
Words are my weapon—crafting killer copy, decoding trends, and turning data into gold. When not strategizing: Coffee addict, pun enthusiast, and book lover. Ready to level up your eCommerce game? Let’s chat. ☕️