



Turn return chaos into clear insights in one dashboard
A unified dashboard centralizes return requests, status updates, and customer interactions. Get real-time insights to optimize return rates, processing time, and operational decisions.


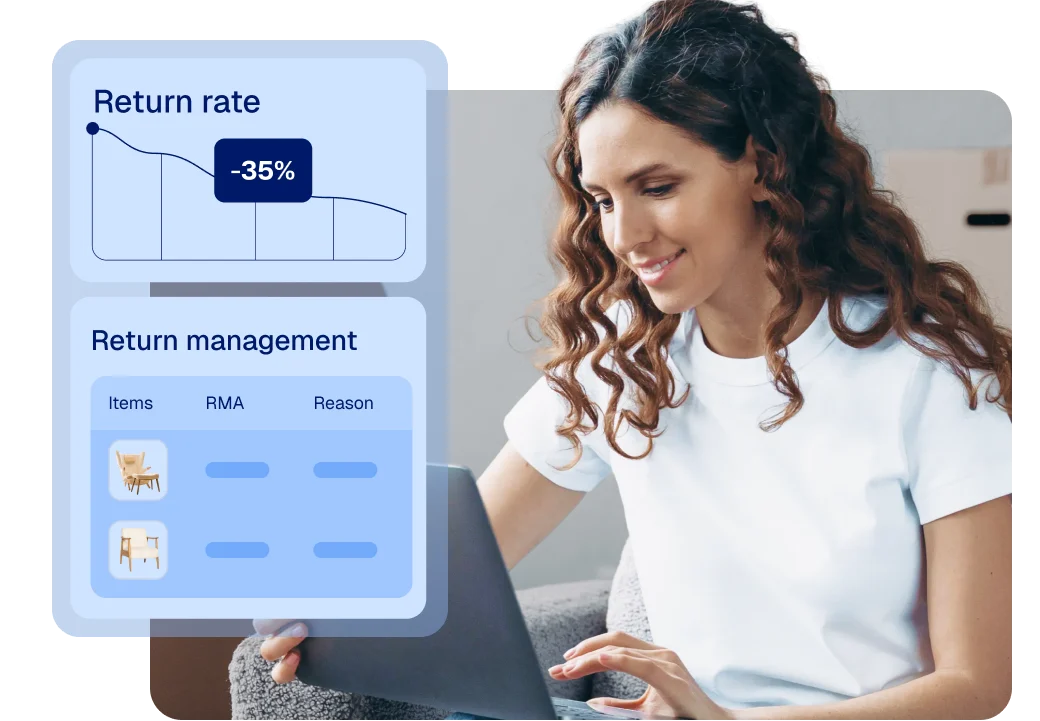
Powering 30,000+ Shopify & DTC brands















What we deliver
Optimize return performance
with data analytics

How we help
Manage, analyze, and act on returns in one place
Scattered returns create costly confusion. Our dashboard centralizes all return data—costs, reasons, and patterns, giving you clear insights to control expenses, improve workflows, and make smarter decisions effectively.

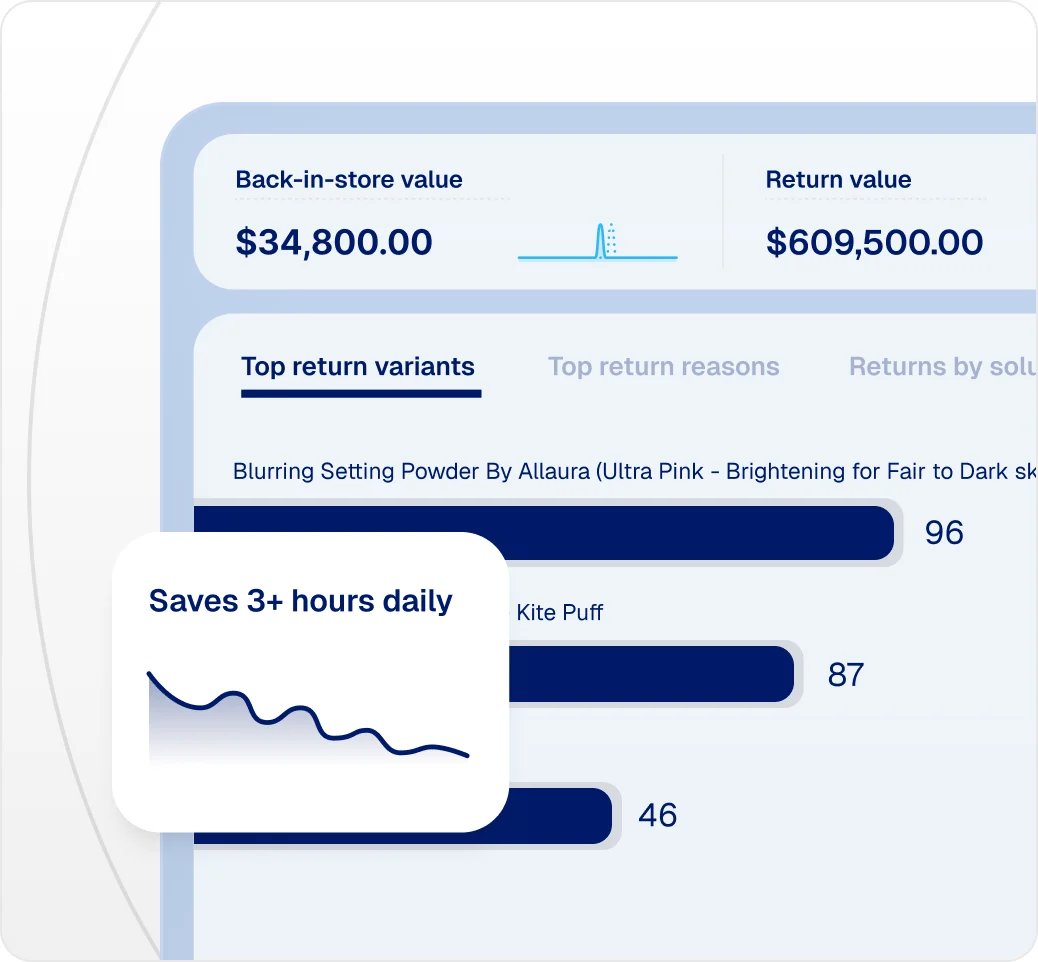
Cost metrics dashboard
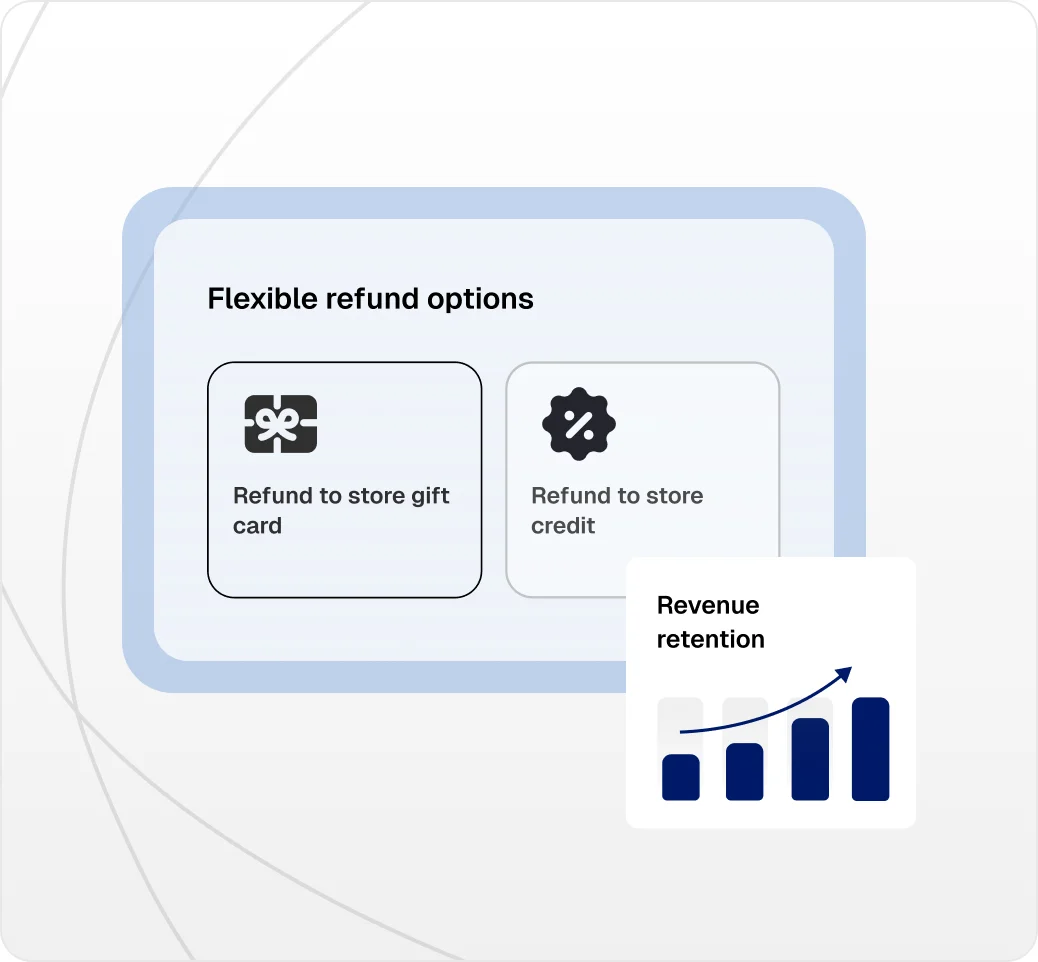
Know exactly what returns cost you. Track shipping expenses, restocking fees, refund amounts, and how much revenue you're keeping through exchanges and store credit.
No more guessing at your return costs—see the real numbers affecting your profits. Every metric explains what it means so you're never confused.

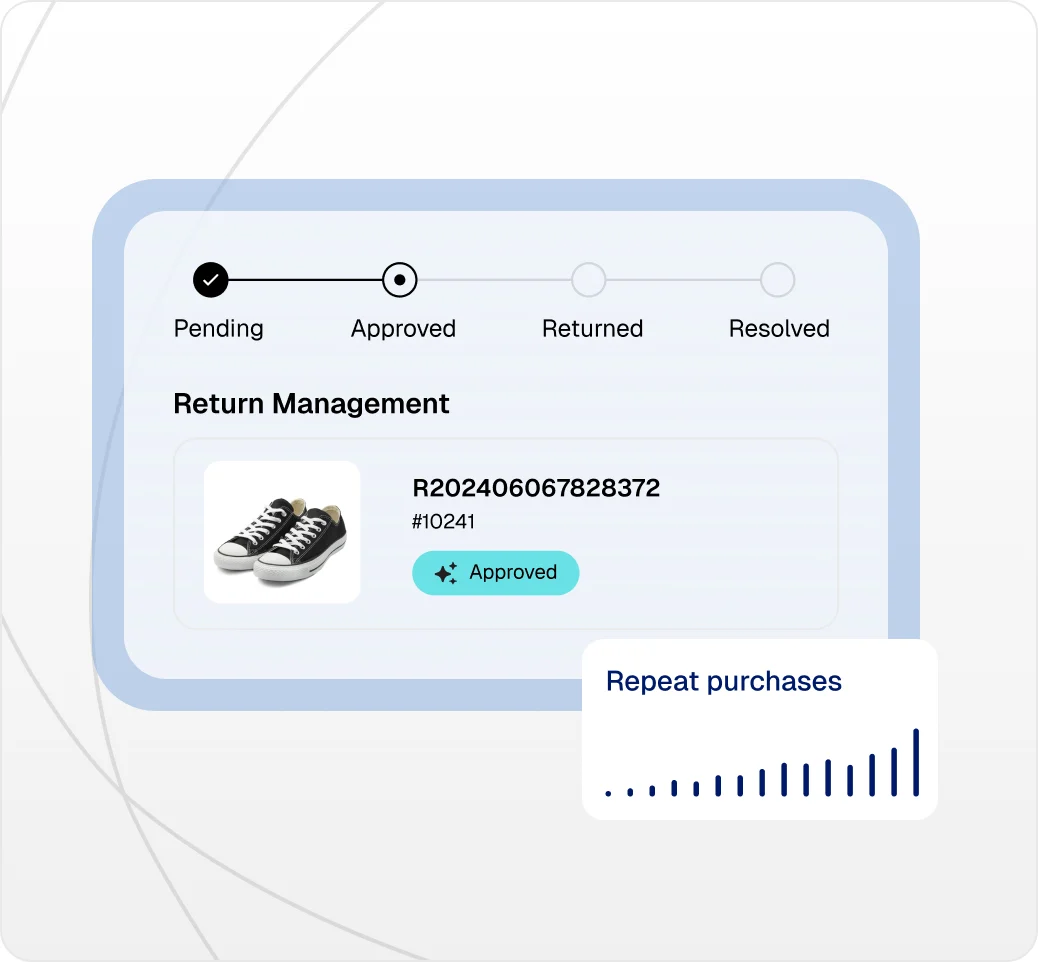
Return management & data capture
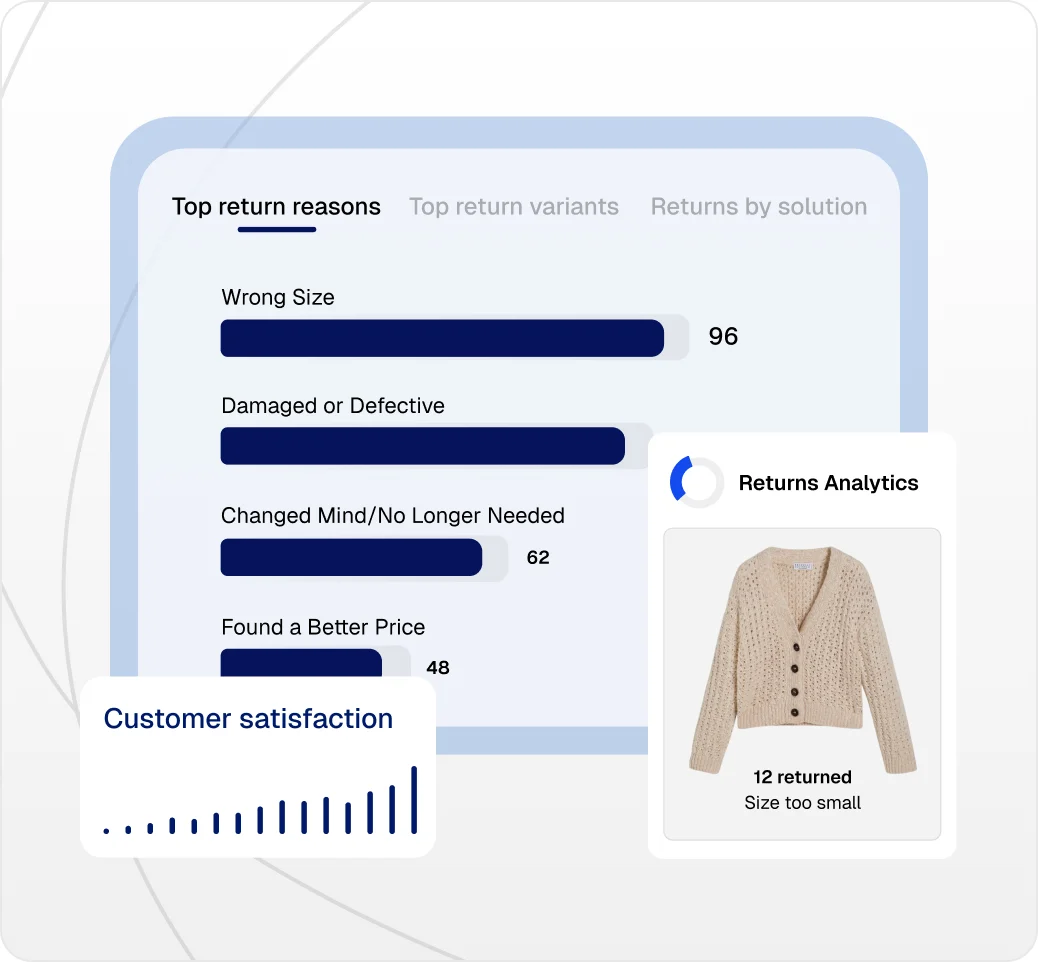
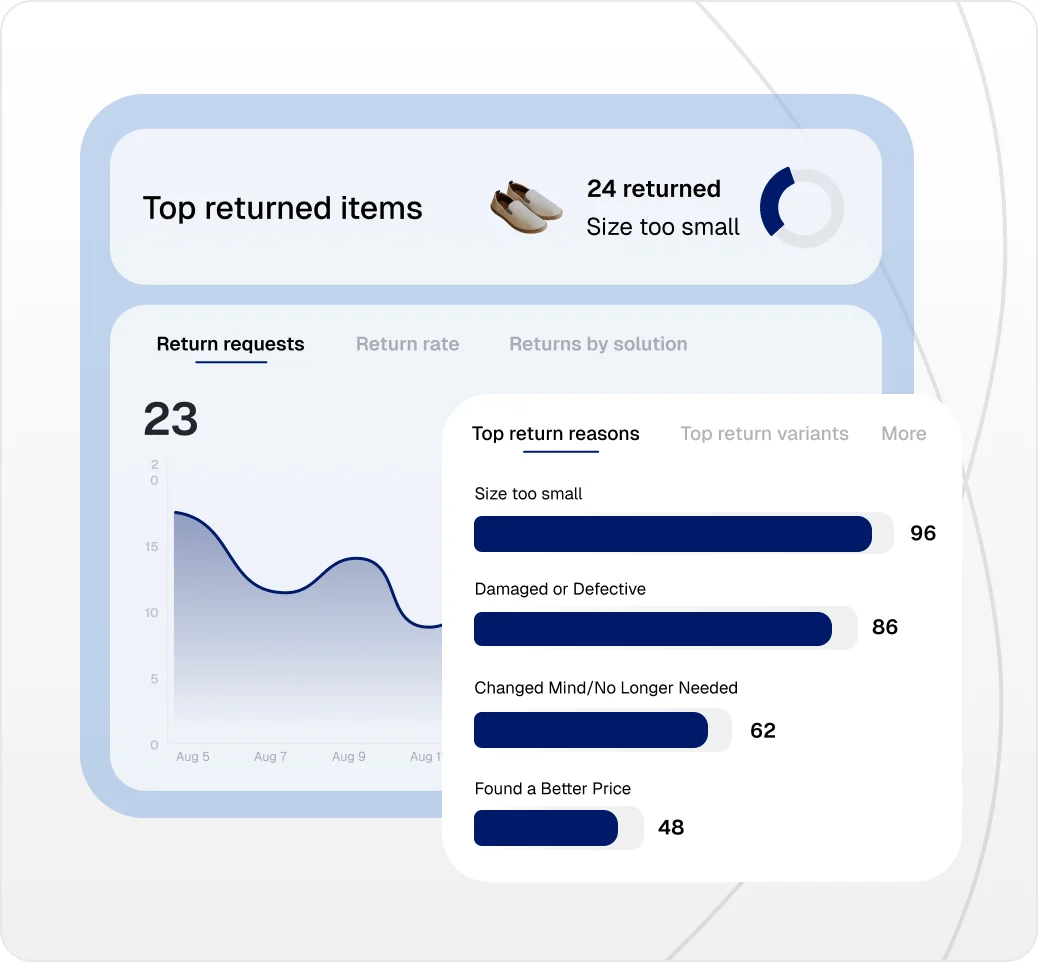
Get the details that matter most. See which products customers return, why they're sending them back, and how often it happens.
Spot your top returned items and the reasons behind each return request. When you know what's coming back and why, you can actually do something about it.

Automated return reports
Skip the spreadsheet work and get reports that actually help. The system automatically analyzes and builds reports on return requests, financial performance, products, and customer behavior.
Track return rate, retained revenue, cash refund, most-returned products, and serial returners on the go.


Actionable return insights
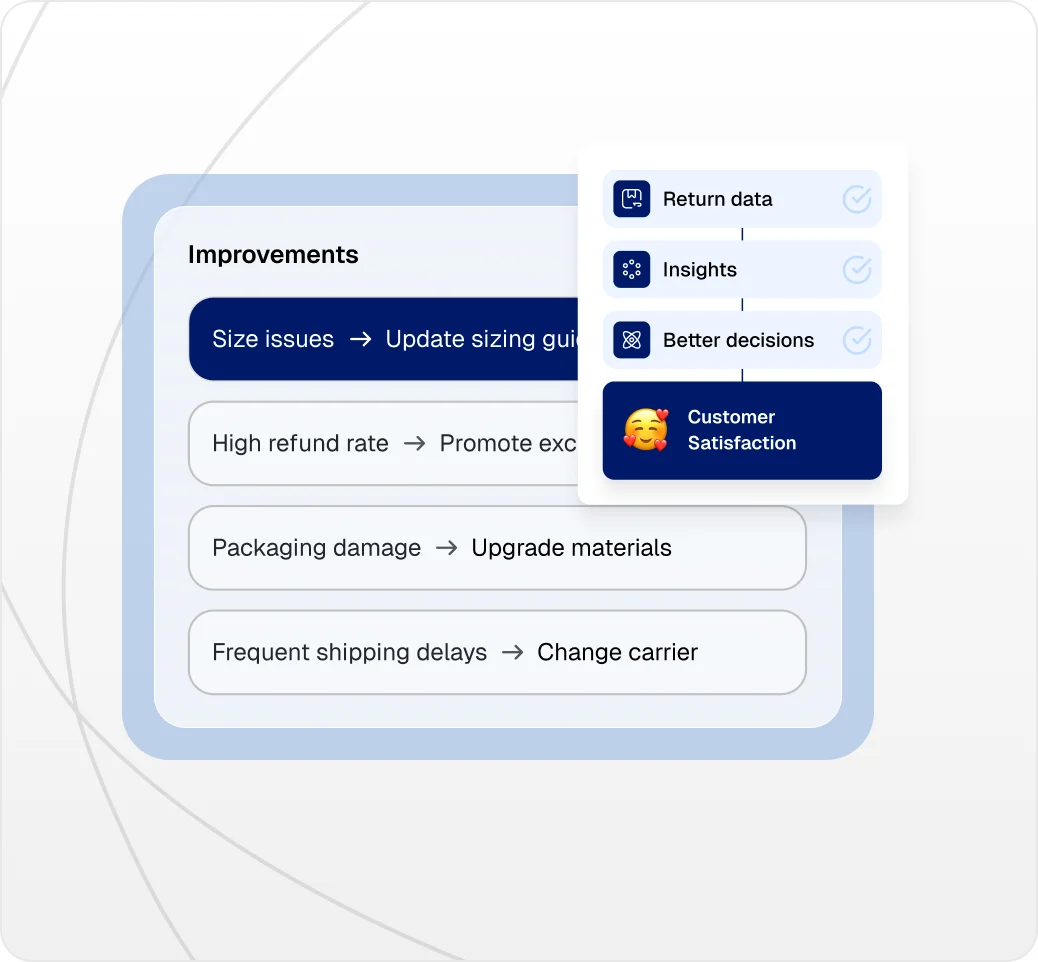
Use your return data to make better business decisions. Compare return patterns across products, reasons, shipping methods, and costs to find what's working and what isn't.
Then adjust your logistics, tweak your return policies, or figure out when free returns actually pay off.

Turn return chaos into organized efficiency
Take control of your returns with a dashboard that brings your return data, eliminates confusion, and saves hours of manual work every week.
Real results from brands like yours


43%
Fewer return inquiries
As Ever‑Pretty scaled globally, long production times and delayed deliveries created anxiety for customers. Without visibility into shipments or an efficient returns process, the support team was swamped with “Where is my order?” and refund-related inquiries.
To fix this, Ever‑Pretty implemented CWILL’s Order Tracking and Returns & Exchanges solutions. Customers now track orders and manage returns on their own, while the team uses automation and analytics to save time and recover revenue. The result: WISMO tickets dropped 68%, return questions fell 43%, and over 54% of refund value was recovered.
What our customers are saying
Our returns & exchanges solution helps Shopify and DTC brands transform their returns experience. But don't take our word for it, see what our customers say:

If I could give 100 Stars for this App, I would. We can't fault the amazing and we mean AMAZING customer service and support. Developers who truly listen to the needs of their customers. We turned to this App because other "return" apps just didn't meet our needs for us to be able to provide a seamless customer experience, but Parcel Panel Returns & Exchanges has filled the gap in the market. Thank You!!
Okay, 2 words to describe this app: SIMPLY AMAZING. I took time to work with the app to set up all the points before leaving my review. This app is just wonderful, and the customer service is fast, so fast. I recommend every e-commerce store on Shopify to use the app to set up their returns. You will love it. A special thanks to Donna for her quick help every time I have a question.
CWILL's return & exchange service has been a game-changer for our customer experience. Since we started using it, our customers no longer have to go through the hassle of emailing to request returns—everything is streamlined and user-friendly. Highly Recommended!
I just downloaded the app and had a lot of questions because I have been looking for an app that also covers international returns. This app does that but I needed to know how and what. Jessca answered all my questions (and there were a lot) swiftly and provided screenshots to show me where to go. Jessca was really brilliant. Thanks very much Jessca!
This app seems to do it all. Allows you to customize your returns and exchange options. It also has a built in shipping/returns policy. Dee was very helpful, polite and awesome to chat with all while helping me quickly. Turns out, not only is this a good app to use but their customer service is great too.
I love that we can provide ease of convenience to our customers by having the returns and exchanges portal. I appreciate being able to modify the written text boxes and linking to our Returns Policy. I would have liked to see more personalization options with the font selections however, but that is not a deal breaker as a merchant.
I looked at many apps to compare features and functionality. If you are looking at this one now, do not hesitate in giving it a go. Such a great and easy to use app and the customer service is incredibly quick and to the point. Amazing service from Donna. Thank you so much!
It seamlessly integrates with Shopify and simplifies return management significantly. The user interface is clear and user-friendly, making it easy to handle returns efficiently. I highly recommend this app to any Shopify store owner looking to streamline their returns process. It's a must-have tool for improving customer satisfaction and operational efficiency!
Wonderful app and a wonderful service. I had a technical problem that customer service managed to help sort out in the space of 5 mins. Thank you.
CWILL Returns & Exchanges solution
Explore more features
- Learn more
Self-Service Returns Portal
Enable convenient self-service returns that collect return reasons, reduce support tickets, and save time.
- Learn more
Smart Returns & Exchanges
Guide customers toward exchanges and store credits instead of refunds to retain more revenue and boost satisfaction.
- Learn more
Return Workflows & Automation
Streamline return processing with automated workflows that handle routine tasks and speed up resolutions.
- Learn more
Return Tracking & Notifications
Track return shipments in real time and send proactive notifications to keep customers informed throughout the process.
- Learn more
Flexible Return Logistics
Connect with major international carriers and offer multiple return methods that match customer preferences.
- Learn more
Return Protection
Strategically offer free returns based on customer segments to reduce return rates and increase customer lifetime value.


Frequently asked questions
Our dashboard tracks all return-related costs including shipping fees, restocking fees, return rates, and revenue retained through exchanges and store credit. You can see your most returned products, return reasons, and frequency patterns across products and shipping methods. Every metric includes explanations so you understand what the numbers mean for your business.
CWILL's returns analytics shows your highest-return products and why customers return them. You can identify patterns like sizing issues, quality problems, or misleading descriptions, then take action—improve size guides, update product descriptions, or work with suppliers on quality.
The centralized dashboard significantly reduces time spent on return management through instant search capabilities and smart filtering that eliminate hours spent hunting through scattered return records. Everything is organized in one place with powerful search tools and real-time updates.
The system enables batch processing and automated organization that cuts down on time-consuming administrative tasks. This organized approach not only saves time but also ensures more accurate return processing by preventing mistakes and ensuring consistent handling of every RMA.
The financial report shows you exactly where your money is going across five key areas: return protection sales, return shipping costs, shipping fees, restocking fees, and return rewards.
Use the time-series chart to identify cost spikes and correlate them with campaigns or seasonal trends. The "Top return reasons" tab reveals expensive return causes—if "wrong size" is your top reason, invest in better size guides. The "Return resolution mix" tab shows whether customers prefer refunds, exchanges, or store credit, helping you optimize incentives to retain revenue. Focus on the highest-cost areas first and use trend data to measure improvement.
See what CWILL Returns &
Exchanges can do for your brand
Map your unique challenges with a CWILL expert. We'll show you how to build a returns process customers love—and one that turns returns into repeat sales.
Book a demo